When accessing open data from government agencies, it's often presented as a map or dashboard using ArcGIS (and not raw data). Governments do this because ArcGIS does a great sales job of presenting itself as an "open data hub", and it's easy for them to wire ArcGIS directly up to the internal systems generating the data. The cost of doing that, however, is that it's often more difficult to find the underlying data and do your own work on it - but with a little work, we can still access it.
Recognizing ArcGIS
In order to use this technique, you need to be sure that the data you're looking for is being hosted by ArcGIS. The easiest way to confirm this is by looking at the URL - it'll often contain the word arcgis:

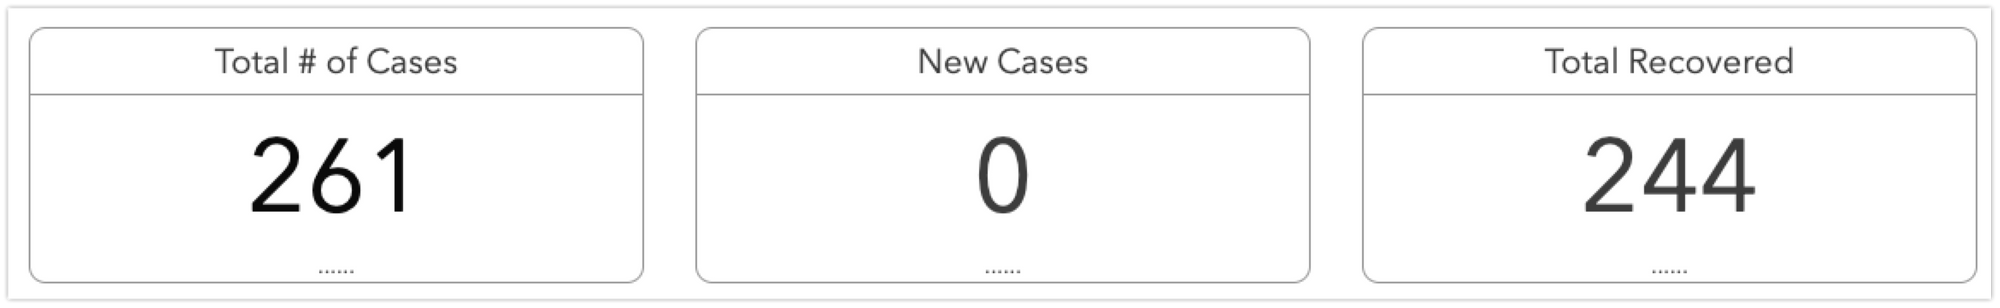
The other easy way to recognize ArcGIS is by the look-and-feel of their dashboards:
or their browser icons:

Once you have a good feeling that you're looking at an ArcGIS dashboard, it's time to go looking for the underlying data.
Accessing the Underlying Data
ArcGIS is API-driven, so our task here is to find a way to interact with the API and retrieve the data in the form we want. Because of the many ways ArcGIS dashboards can be set up, I've found the most reliable way to find the API is using Chrome's DevTools to see where the dashboard's API requests are sent.
With DevTools open, browse to the ArcGIS page you'd like to find the data for, and look at the Network tab, typing query into the Filter filed. You'll see something like this:
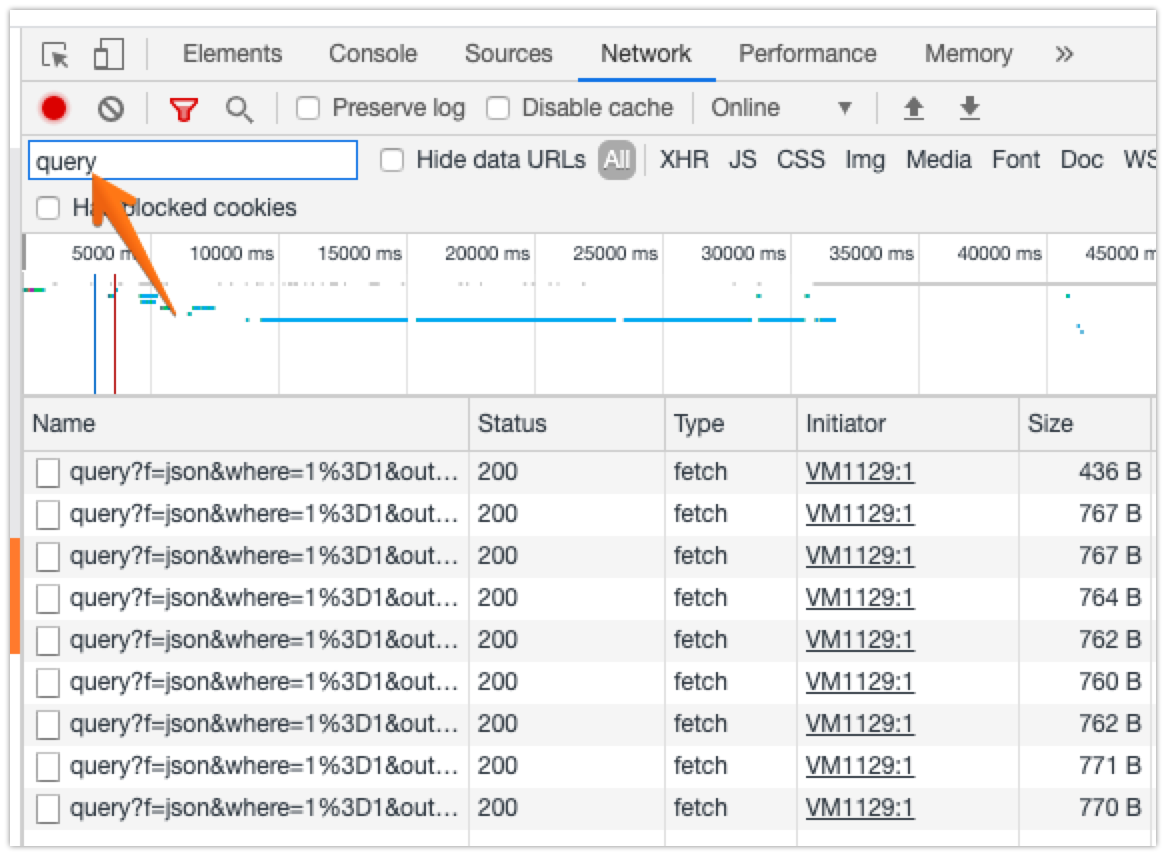
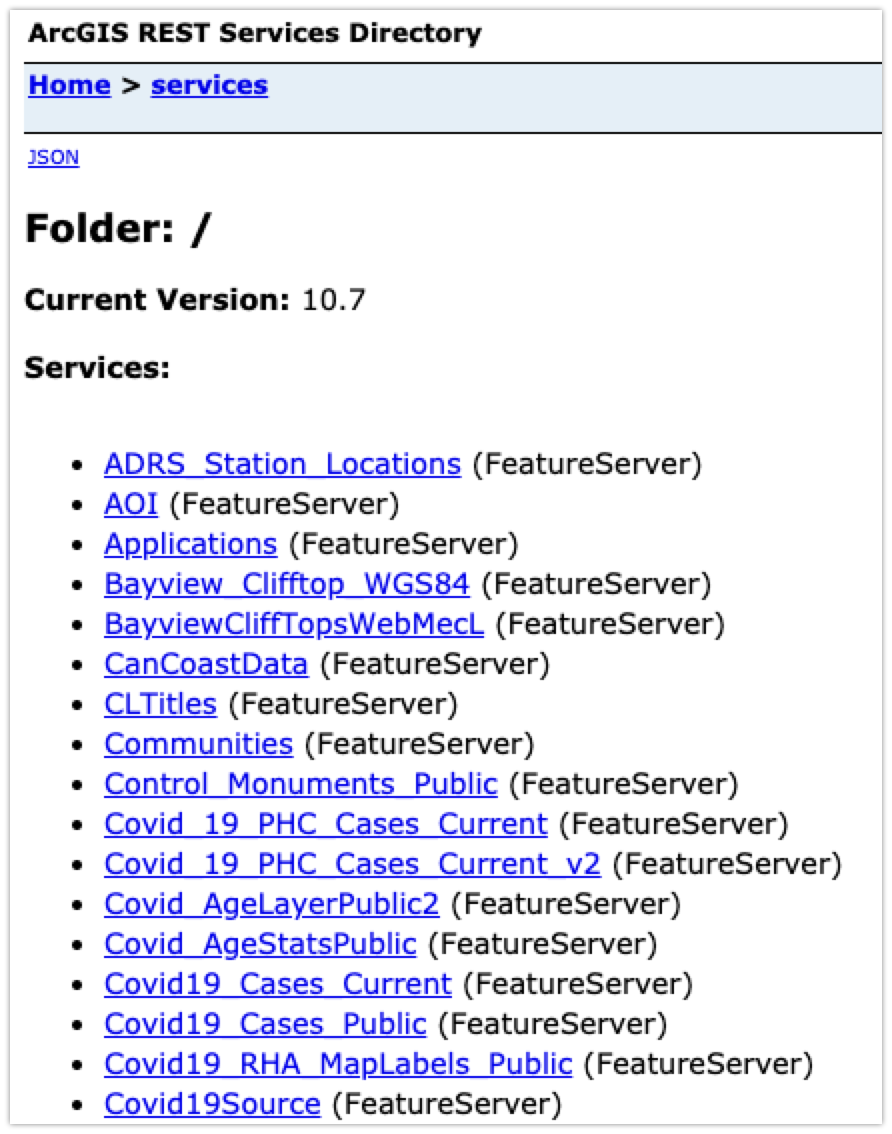
Those query?f=json... lines are the API requests we're trying to find. Right-click on one of them, select Copy → Copy as link address, and then paste that into your browser's location bar. In my example, I get https://services8.arcgis.com/aCyQID5qQcyrJMm2/arcgis/rest/services/RHA_CurrentStats2_Public2/FeatureServer/0/queryf=json&where=RHAShort%3D'Central_RHA'&returnGeometry=false&spatialRel=esriSpatialRelIntersects&outFields=*&resultOffset=0&resultRecordCount=25&resultType=standard&cacheHint=true. Delete everything after /rest/services/, and then go to that page - in my example, I end up with https://services8.arcgis.com/aCyQID5qQcyrJMm2/arcgis/rest/services/. This is a list of all the different ArcGIS data sources that have been made public on this server, and looks something like this:
On this list, it's important to be selective about the data you pick. You're looking at the raw data here, without the context of how it's captured, how up-to-date it is, how it's been processed, etc. You'll often see several version of the "same" data (e.g. Covid_19_PHC_Cases_Current and Covid_19_PHC_Cases_Current_v2) and not know how or why they're different,
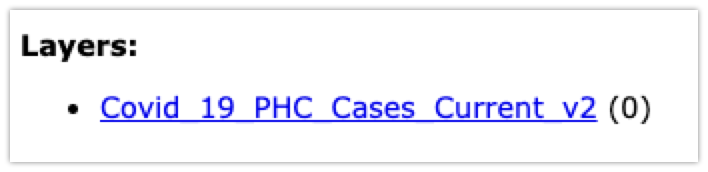
Once you've found a service that sounds interesting, click into it, and then click into the Layer that has the data you want:
On this screen, you can see the fields in each record (Fields) and when the data was last updated (Last Edit Date). Click Query at the bottom (next to Supported Operations), and you'll get the API query page:
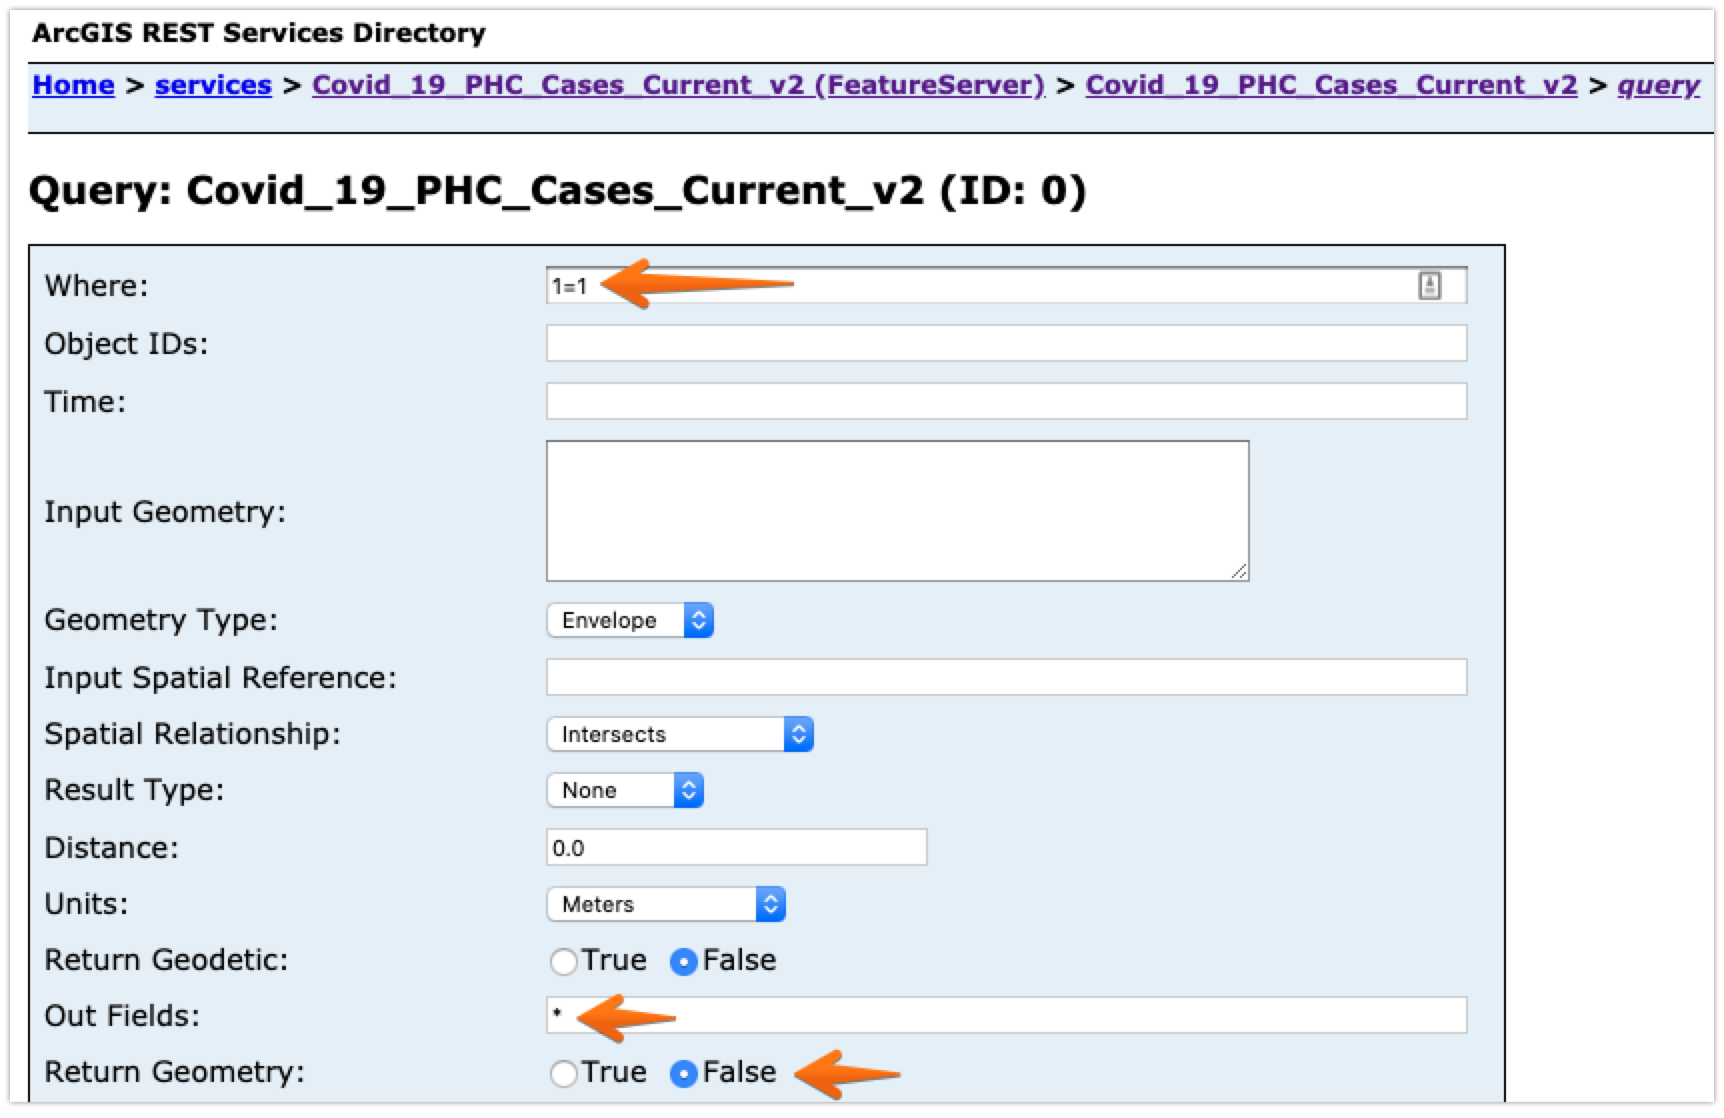
You have three fields to update before pressing Query (GET) at the bottom:
- Set Where to
1=1. This tells the system that you want all records where1=1, which is another way of saying you want all of them. - Set Out fields to
*. This tells the system that you want all fields in each record. Once you understand what's there, you can change this to be a comma-separated list of only the fields you want. - Set Return Geometry to
False, assuming you're looking for data values and not mapping polygons.
Once you've done that and press Query (GET), you'll see the first page of your data displayed. From that data, you can select the fields you're interested in, and put them into the Out fields box. When you're ready to go, change the Format box to JSON, and press Query (GET) again.
This time, you'll end up with a JSON-only result that looks something like this:
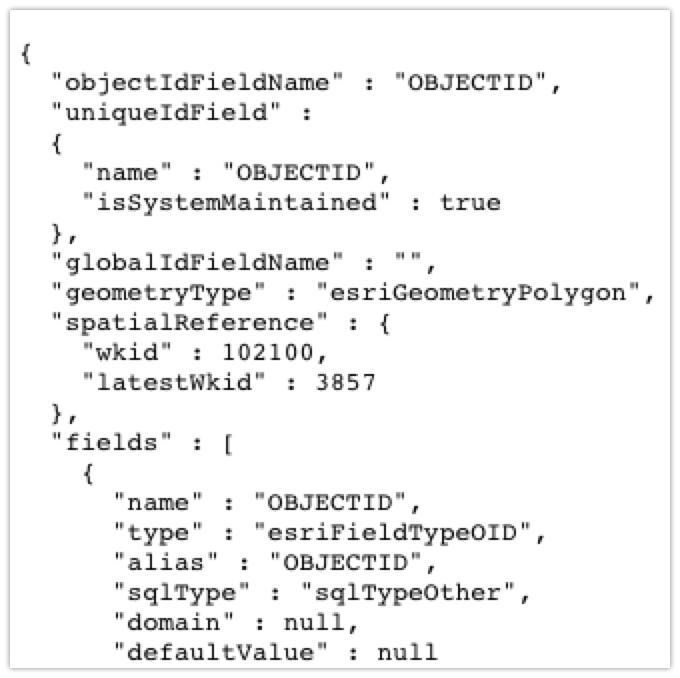
and a URL that looks like https://services8.arcgis.com/aCyQID5qQcyrJMm2/ArcGIS/rest/services/Covid_19_PHC_Cases_Current_v2/FeatureServer/0/query?where=1%....
This page is your raw data in machine-readable form, and that URL pulls new data each time you visit it. You can now add this into your data pipeline, and use the identical data that's driving the Government visualizations. You can also do interesting things like watching how the data changes over time (by downloading it every day), like I've done here.